
Anaerobic Digestion for Biogas Projects: Commercial Deployment and Process Optimization
Anaerobic digestion is biologically simple but commercially demanding. The same microbes that quietly convert manure to methane in a lagoon will, inside an engineered anaerobic digestion biogas project, only deliver design gas output when temperature, loading, alkalinity, and nutrients are held inside a narrow operating window—every day, for decades. The gap between average and excellent operators routinely reaches 20-40% in gas yield per tonne of feedstock.
That gap is money. A 1 MW project losing 25% of design yield forfeits roughly $300,000-600,000 in annual revenue. Yet most losses trace to a handful of controllable factors: unstable organic loading, ammonia or VFA accumulation, inadequate monitoring, and feedstock drift from the design basis. None of these require new technology—only disciplined process control.
This guide covers the commercial operation of anaerobic digestion for biogas projects: the biology that must be respected, the monitoring KPIs that predict trouble before gas flow drops, commissioning strategy, feedstock management, and the optimization levers that separate top-quartile plants from the rest.
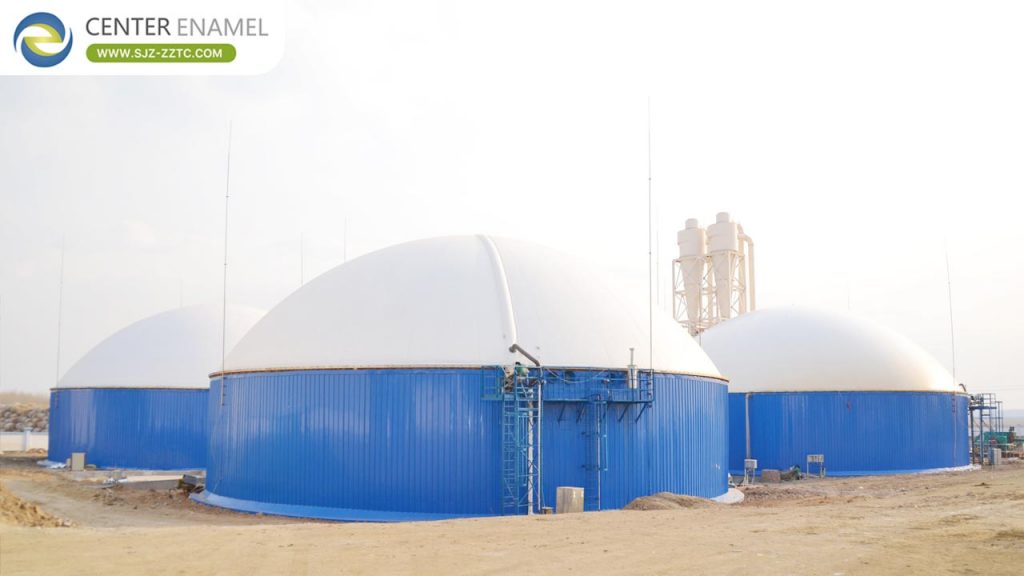
What Does Optimized Anaerobic Digestion Look Like?
Optimized anaerobic digestion for biogas projects means stable methanogenesis running at 85-95% of theoretical methane potential. Operationally this shows up as gas production within 5% of forecast daily, methane content steady at 55-65%, volatile fatty acids (VFA, as acetic acid) below roughly 1,500-3,000 mg/L, alkalinity above 3,000-5,000 mg/L as CaCO3, pH between 7.0 and 8.0, and a VFA-to-alkalinity ratio under 0.3-0.4. When these five indicators hold, the plant is healthy; when any drifts, gas yield follows within days.
Monitoring KPIs: The Daily Control Panel
Commercial digesters monitor in two tiers. Tier one runs continuously or daily: gas flow and CH4/CO2 content (inline analyzers), feedstock tonnage and composition, digester temperature (±1 degree C control), and pH. Tier two runs weekly to monthly in a lab: total and volatile solids, VFA speciation, total ammonia nitrogen (TAN), alkalinity, and micronutrients (Fe, Co, Ni, Mo, Se). Trends matter more than single readings—a VFA/alkalinity ratio creeping from 0.2 to 0.35 over three weeks is an actionable alarm even while gas flow still looks normal.
1. VFA-to-Alkalinity Ratio: The master stability indicator; above 0.4 signals imminent souring—cut feeding immediately.
2. Total Ammonia Nitrogen: Above 2,500-3,000 mg/L (free ammonia above 250-400 mg/L at mesophilic pH), methanogens inhibit; mitigate by feedstock dilution, C:N rebalancing, or acclimation at reduced load.
3. Gas Production per Unit VS Fed: The true yield KPI; compare weekly against feedstock-specific methane potentials (BMP) to detect drift.
4. Hydrogen Sulfide Trend: Rising H2S flags protein surges or sulfate loading before it damages engines.
Commissioning: From Concrete to Full Load
Biological commissioning of an anaerobic digestion biogas project takes 3-9 months from inoculation to full design load. Best practice: start with digestate or sludge inoculum at 30-50% of digester volume, begin feeding at 20-30% of design OLR, and increase loading only when VFA/alkalinity and gas yield confirm stability—typically stepping up 10-20% of design load every 1-3 weeks. Thermophilic conversions add a careful 1 degree C per day ramping phase. Projects that rush commissioning to hit contractual deadlines routinely pay for it with a sour digester and a 3-6 month restart.
Comparative Data Table: Common Digester Instability Causes and Countermeasures
| Instability Cause | Early Indicators | Consequence if Ignored | Primary Countermeasure |
| Organic overload | VFA rise, CH4% drop, foam | Souring (pH < 6.8), weeks of lost gas | Cut feed 30-50%; resume on stability |
| Ammonia inhibition | Rising TAN, gas yield plateau | Permanent 30-50% yield loss | Dilute, add carbon feedstock, acclimate |
| Temperature shock | ±2 degrees C swings, VFA rise | Methanogen population crash | Redundant heating, alarm interlocks |
| Feedstock toxin entry | Sudden yield drop after delivery | Extended biological damage | Feedstock acceptance testing + contracts |
| Nutrient deficiency (Co/Ni) | Slow VFA turnover, propionate buildup | Chronic underperformance | Micronutrient dosing per lab analysis |
| Mixing dead zones | Scum mat, grit cone, local acid pockets | Effective volume loss 10-30% | Scheduled mixing audits, desludging |
Frequently Asked Questions (FAQ)
Q1: What is the fastest way to increase biogas output from an existing digester?
A: Feedstock optimization before hardware changes. Co-digesting energy-dense substrates (food waste, grease, silage) with the base manure or sludge typically lifts methane yield 25-60%, since fats carry roughly three times the methane potential of carbohydrates. Verify hydraulic and nitrogen capacity first, then ramp additions gradually over 4-8 weeks while watching the VFA/alkalinity ratio.
Q2: How often should a commercial digester be desludded?
A: Grit-heavy feedstocks (poultry, separated solids, municipal organics) accumulate inerts at 0.5-2% of feed volume, meaning meaningful capacity loss within 4-8 years. Proactive plants schedule partial desludging every 3-5 years; two-tank designs allow this without full shutdown. Delaying until symptoms appear usually costs more downtime than planned removal.
Q3: Can a soured digester be recovered, and how long does it take?
A: Yes. Stop feeding, restore temperature, dose alkalinity (bicarbonate or soda ash) to bring pH above 6.8, and wait for methanogens to consume accumulated VFA—typically 2-8 weeks depending on severity. Re-seeding with 10-30% healthy digestate from a neighboring plant accelerates recovery substantially. Restart feeding at 20% load and step up cautiously.
Q4: What does a biogas plant operator actually do all day?
A: On a well-instrumented plant, daily routine centers on 60-90 minutes of data review (gas flow, CH4%, temperatures, feed log), visual inspection (foam, leaks, mixer operation), and feedstock intake QC; the rest of the day covers maintenance coordination, lab sampling, and reporting. Remote monitoring now flags most excursions automatically—but the discipline of physically walking the plant daily catches what sensors miss.