
CBG Plants: Complete Guide to Compressed Bio-Gas Plant Setup and Economics
A CBG plant (compressed bio-gas plant) takes raw biogas from anaerobic digestion, upgrades it to more than 90% methane, and compresses it to 200-250 bar into a fuel chemically equivalent to CNG. In markets from India to Europe and North America, CBG has become the fastest-growing monetization route for organic waste—commanding transport-fuel prices and policy support instead of low wholesale power tariffs.
The commercial momentum is policy-led. India's SATAT initiative targets 15 million tonnes per year of CBG with guaranteed offtake from oil marketing companies; the EU's RED III sets advanced biofuel quotas that CBG satisfies; and North American low-carbon fuel standards pay premium prices for waste-based biomethane. Result: CBG plant projects now routinely out-earn electricity-only biogas configurations by 1.5-3x per cubic meter of raw gas.
This guide covers the complete CBG plant picture—process configuration from feedstock to dispensing, technology choices, capital and operating costs, revenue models, and the practical economics of building and running a compressed bio-gas business.
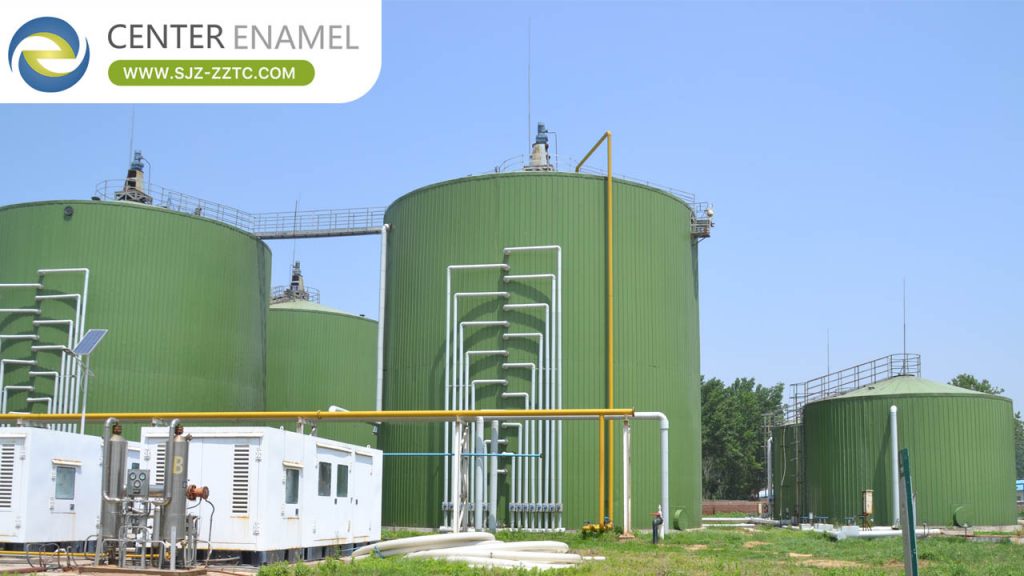
What Is a CBG Plant and How Does It Work?
A CBG plant is an integrated waste-to-fuel facility comprising five process blocks: feedstock reception and pre-treatment; anaerobic digestion (typically CSTR at mesophilic temperature, 20-30 day HRT); biogas upgrading to 90-97% methane (water wash, PSA, or membrane systems); compression to 200-250 bar with priority-panel gas storage; and dispatch via cascades, truck loading, or retail dispensing. Digestate is dewatered and sold as organic fertilizer, often contributing 5-15% of plant revenue.
CBG Plant Configurations and Technology Selection
Two decisions dominate CBG plant design: digestion technology matched to feedstock, and upgrading technology matched to scale and gas spec. Press mud, cattle dung, and food waste suit complete-mix digesters with 8-12% solids operation; agricultural residue streams require pre-treatment (mechanical or thermal) to open lignocellulose. On upgrading, membrane systems (two- or three-stage) now hold the largest market share for their modular scalability and 1-2% methane slip; water wash suits large single trains; PSA fits smaller plants with cheap energy.
1. Feedstock Planning: Secure 10+ year supply agreements; feedstock is 30-50% of production cost for purchased substrates, so press-mud alliances with sugar mills or municipal food-waste contracts anchor bankability.
2. Upgrading Selection: Compare CH4 recovery (target 99%+ for membrane 3-stage), specific energy (0.15-0.35 kWh/m3 biogas), turndown flexibility, and H2S pre-cleaning requirements.
3. Compression and Storage: Priority panels, 200-250 bar compressors, and 3-5 days of buffer storage smooth production-consumption mismatches.
4. Dispatch Infrastructure: Cascade truck unloading or direct pipeline injection where available; retail dispensing requires separate licensing.
Comparative Data Table: CBG Plant Economics by Scale
| Parameter | Small (2-5 t/day feed) | Medium (50-100 t/day) | Large (200+ t/day) |
| CBG output | 0.3-1 t/day | 5-12 t/day | 20-40 t/day |
| CAPEX (USD) | $1M-$2.5M | $6M-$15M | $20M-$45M |
| Upgrading technology fit | PSA / small membrane | Membrane 2-3 stage | Membrane multi-train / water wash |
| Production cost (USD/kg CBG) | $0.7-1.0 | $0.5-0.8 | $0.4-0.6 |
| Typical payback | 4-6 years | 3-5 years | 3-5 years |
| Manpower (FTE) | 4-8 | 10-20 | 25-45 |
Revenue Model and Market Demand
CBG plant revenue stacks fuel sales at CNG-parity pricing (or better where low-carbon credits attach), fertilizer revenue from granulated digestate, tipping fees for received waste, and—where applicable—carbon or compliance credits. In India, SATAT offtake guarantees pricing tied to retail CNG; in Europe and California, waste-based CBG earns double-counted credits under transport mandates. Demand side, city gas distribution networks, bus and truck fleets converting to CNG, and industrial buyers replacing LPG all compete for CBG supply, keeping offtake risk low relative to merchant electricity sales.
Frequently Asked Questions (FAQ)
Q1: How much investment is needed for a profitable CBG plant?
A: A bankable small plant processing 2-5 tonnes of feedstock daily requires roughly $1-2.5 million all-in; medium plants (50-100 t/day) run $6-15 million. Profitability depends less on scale than on secured feedstock cost and fuel offtake price—plants with near-zero feedstock cost (own waste or paid tipping) can break even at half the throughput of plants purchasing feedstock.
Q2: Which feedstock gives the best CBG yield per tonne?
A: Fat-rich food processing waste and used cooking oil top the table (0.6-1.0+ m3 CH4/kg VS), followed by food waste (0.4-0.5), press mud (0.3-0.4), and cattle dung (0.2-0.3). Practical plants blend: a high-yield co-substrate dosed into a manure or press-mud base typically maximizes methane per digester cubic meter without destabilizing biology.
Q3: Is government subsidy available for CBG plants?
A: India's SATAT program offers central financial assistance up to roughly 10-20% of project cost for small and medium plants alongside 10-year offtake commitments from oil marketing companies; Europe and North America rely more on fuel-mandate credits (RED III, LCFS, RFS RINs) than capital grants. Check current scheme terms during feasibility, since subsidy windows change with budget cycles.
Q4: What are the main operational risks in a CBG plant business?
A: Feedstock supply disruption remains the top risk, followed by upgrading downtime and compressor maintenance. Mitigations are contractual: diversified feedstock contracts with penalty clauses, membrane redundancy (N+1), and preventive maintenance contracts with upgrading OEMs. Well-run plants sustain 90-95% annual availability; unplanned upgrading outages are the most common cause of flaring losses.