
Circular Economy with Biogas Projects: Closing the Loop on Waste and Energy
Circular economy with biogas project development represents one of the clearest industrial demonstrations of circularity in action. The linear economy takes resources, makes products, and discards waste; a circular economy keeps materials and energy flowing in loops. Anaerobic digestion is uniquely positioned at the junction of these loops - it converts society's organic waste back into energy and fertilizer instead of sending it to landfill.
For companies under pressure to report ESG performance, the numbers are compelling: food processors and municipalities can cut landfill volumes, avoid methane emissions, generate renewable energy, and return nutrients to farmland - all from one integrated facility. This is not greenwashing; it is a measurable, auditable closed loop.
This guide explains how a biogas project embodies the circular economy, maps the material and energy flows, and shows how to quantify and communicate circularity to investors, regulators, and customers.
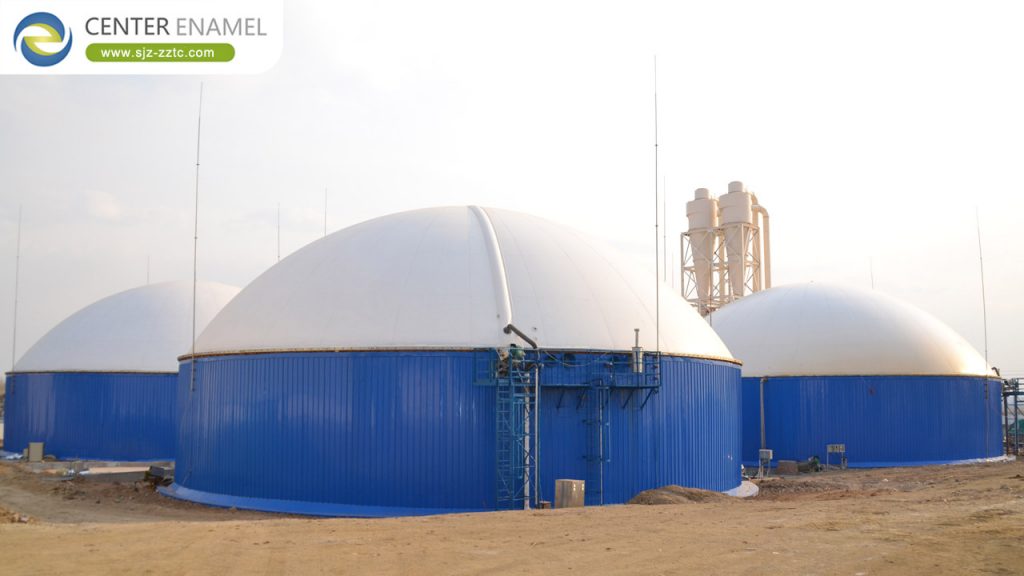
Understanding the Circular Economy Model in Biogas
The circular economy rests on three principles: design out waste, keep materials in use, and regenerate natural systems. A biogas project does all three: it treats unavoidable organic waste, converts it into usable energy and fertilizer, and returns organic matter to soil where it rebuilds carbon stocks and microbial life.
Biogas is one of the few technologies where the 'waste' stream is itself the value stream. Feedstock becomes fuel; digestate becomes fertilizer; captured methane becomes a carbon credit. Every output has a market, which is the defining feature of a circular business model.
- Design out waste: organic residues become inputs, not disposal liabilities.
- Keep materials in use: nutrients circulate from soil to crop to waste to digestate and back to soil.
- Regenerate natural systems: digestate improves soil organic matter, reducing synthetic fertilizer dependence.
- Energy independence: on-site power and heat cut reliance on fossil grids.
Comparative Data Table: Linear vs Circular Biogas Model
The table makes the economic case visible: the same tonne of waste generates cost in a linear system and revenue in a circular one. This is why circular economy with biogas project models increasingly underpin the business plans of food and beverage companies, municipalities, and agricultural cooperatives.
| Flow | Linear Model | Circular Biogas Model |
| Organic waste | Landfilled or incinerated | Received as paid feedstock |
| Energy | Purchased from grid (fossil mix) | Produced on-site from waste |
| Fertilizer | Synthetic, carbon-intensive | Digestate returned to soil |
| Methane emissions | Released to atmosphere | Captured and converted |
| By-product value | None (cost centre) | Gas, heat, fertilizer, credits (revenue centre) |
| System outcome | Resource depletion | Closed nutrient and energy loops |
Mapping the Closed Loop: Waste to Energy to Soil
Each step creates a verifiable circularity metric: tonnes diverted from landfill, kWh generated from waste, tonnes of CO₂e avoided, and tonnes of nutrients returned to soil. These metrics form the backbone of ESG reporting and sustainability-linked financing.
- Collection and reception: source-separated organic waste arrives with a tipping fee, securing a contracted revenue stream.
- Anaerobic digestion: the waste is converted into biogas and digestate in a sealed, heated digester.
- Energy utilization: biogas generates power and heat on-site, or is upgraded to biomethane for injection and fuel.
- Digestate processing: solid-liquid separation yields a fibrous soil conditioner and a liquid nutrient concentrate.
- Return to soil: both fractions are applied to farmland, restoring organic matter and reducing synthetic fertilizer use - closing the loop.
Measuring and Communicating Circular Value
In an era where green claims are scrutinized, the circular economy with biogas project model stands out because its benefits are physical and measurable. The loop is visible in the supply chain, and every tonne of output can be traced back to a tonne of waste input.
- Circularity indicators: track landfill diversion rate, renewable energy share, nutrient recycling rate, and virgin-resource substitution.
- Carbon accounting: methane avoidance and displaced fossil energy convert directly into verified emission reductions for CSRD, GHG Protocol, and voluntary carbon markets.
- ESG reporting: biogas projects provide auditable data across environmental (emissions, waste), social (local jobs, soil health), and governance (supply-chain resilience) dimensions.
- Stakeholder communication: quantify the project in terms stakeholders understand - homes powered, tonnes of waste diverted, hectares of farmland fertilized.
Frequently Asked Questions (FAQ)
Q1: How does a biogas project contribute to the circular economy?
A: A biogas project closes three loops at once: the energy loop (waste becomes renewable power and heat), the nutrient loop (digestate returns nitrogen, phosphorus, and potassium to soil), and the carbon loop (biogenic carbon circulates between atmosphere and crops instead of being released from landfill). This is circularity with physical, auditable outputs.
Q2: Is digestate really as good as chemical fertilizer?
A: Digestate supplies the same core nutrients as synthetic fertilizer - nitrogen, phosphorus, and potassium - plus organic matter and trace elements that improve soil structure and water retention. It is typically used to partially replace synthetic fertilizer, cutting input costs and the embedded carbon of fertilizer production.
Q3: How do companies report the circular value of biogas projects?
A: Under frameworks such as the EU CSRD, GHG Protocol, and GRI, companies report landfill diversion, avoided methane emissions, renewable energy generation, and nutrient recycling. Many projects also generate certified carbon credits, providing a third-party-verified, tradeable measure of circularity.