
Dairy Industry Wastewater Treatment: Complete Guide to Compliance, Process Design, and Cost Control
Dairy processing generates one of the most concentrated organic waste streams in the food industry. Every liter of milk processed can produce roughly 2.5 liters of wastewater, loaded with lactose, proteins, fats, and cleaning chemicals that push COD levels as high as 95,000 mg/L . Whether you operate a cheese plant, a yogurt facility, or a fluid milk processor, getting dairy effluent treatment right is not just an environmental obligation-it is a cost center you can optimize, a compliance risk you can eliminate, and in some cases, an energy opportunity you can capture.
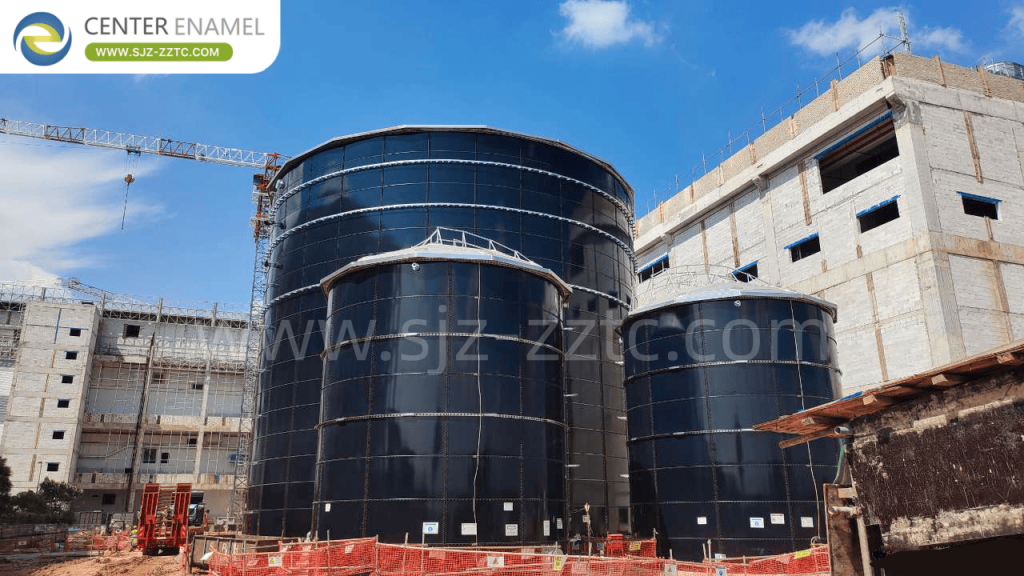
This guide breaks down what makes dairy wastewater unique, how modern treatment trains are designed, what discharge limits you are likely facing, and where the hidden costs live. If you are evaluating an upgrade or building a new plant, this is the technical foundation you need before talking to an engineer.
What Makes Dairy Wastewater So Challenging?
Dairy effluent is deceptive. It looks milky and relatively benign, but its organic strength is severe. The core problem is simple: milk solids are designed by nature to be highly biodegradable. Lactose, whey proteins, and butterfat all break down rapidly, which means they consume oxygen at a ferocious rate when they enter a water body or a treatment system.
COD concentrations in raw dairy wastewater commonly range from 80 to 95,000 mg/L, while BOD spans 40 to 48,000 mg/L depending on the product mix and how much product is lost to drains . The COD-to-BOD ratio is typically around 1.5 to 2.0, confirming that most of the organic load is readily biodegradable . That is good news for biological treatment, but it also means any shock load-a tank dump, a whey spill, a CIP discharge-can overwhelm a system within hours.
The variability is brutal. A cheese plant running a curd wash will send a very different effluent than a fluid milk line doing pasteurization and filling. CIP (clean-in-place) wastewater, which makes up roughly 80% of total effluent volume in some facilities, contributes the bulk of the organic load and brings pH swings from caustic and acid cleaning cycles . Fats, oils, and grease (FOG) float to the surface, coat pipes, and smother biomass if not removed early. The treatment train must be built around these realities, not around a single averaged water sample.
Dairy Effluent Characteristics: What You Are Actually Dealing With
Before selecting any technology, you need a clear picture of your specific effluent profile. The table below summarizes the typical ranges reported across dairy processing operations.
| Parameter | Typical Range in Dairy Wastewater | Primary Sources |
| COD | 80 – 95,000 mg/L | Milk solids, whey, lactose, fats |
| BOD₅ | 40 – 48,000 mg/L | Same as COD (highly biodegradable fraction) |
| Total Suspended Solids (TSS) | 24 – 4,500 mg/L | Curd fines, fat globules, protein aggregates |
| Fats, Oils & Grease (FOG) | Highly variable; often 100 – 1,000+ mg/L | Butterfat, cream, cheese vats |
| Total Nitrogen | 14 – 830 mg/L | Milk proteins, cleaning agents |
| Total Phosphorus | 9 – 280 mg/L | Milk phosphates, detergents |
| pH | 4.7 – 11.0 | CIP acid and caustic cycles |
| Temperature | Often 25 – 40°C | Warm process water, cleaning |
Data compiled from dairy effluent characterization studies .
The practical takeaway is that no two dairy plants produce the same wastewater. A mozzarella factory will have a fat-heavy stream; a skim milk powder plant will have a protein and lactose-heavy stream with far less fat. An ice cream plant adds sugar and stabilizers to the mix. Any treatment design that does not account for your product mix is a guess, not an engineering solution.
The Core Treatment Train: From Primary Separation to Biological Polishing
A well-designed dairy wastewater treatment system is almost always a multi-stage train. No single technology handles the full spectrum of pollutants efficiently. The logic is to remove what can be removed cheaply and physically first, then let biology do the heavy organic work, and finally polish whatever remains.
Primary Treatment: Removing FOG and Solids Before They Cause Trouble
The first job is to get fats and suspended solids out of the water. If FOG reaches the biological stage in high concentrations, it coats biomass, reduces oxygen transfer, and causes sludge bulking. Gravity separation through grease traps and oil-water separators handles the easy floatable material. But for dairy effluent, dissolved air flotation (DAF) has become the workhorse of primary treatment.
DAF uses fine air bubbles to lift fats, oils, and light suspended solids to the surface for skimming. It is far more effective than gravity settling for the fat-rich streams typical of dairy processing . Chemical dosing-often PAC or PAM along with pH adjustment-can improve coagulation and protein removal before the DAF unit, pushing COD removal in primary treatment into the 40–60% range depending on the dose rates and influent strength .
The catch is sludge. DAF generates a fat-rich sludge that is high in water content and difficult to dewater by conventional means. This sludge cannot go to landfill easily and is not suitable for incineration without further processing. Many facilities now route DAF sludge to anaerobic digesters or composting operations where the fat content becomes a biogas feedstock rather than a disposal liability .
Secondary Treatment: Anaerobic and Aerobic Biological Systems
Once the bulk of the fats and solids are removed, the dissolved organic load-mostly lactose and soluble proteins-is ready for biology.
Anaerobic treatment is often the first biological step for high-strength dairy effluent. Upflow anaerobic sludge blanket (UASB) reactors and anaerobic filters can remove 70–90% of COD while producing methane that can be captured for energy. Temperature matters: studies on anaerobic filters treating dairy wastewater show that COD removal drops only modestly-from about 82% to 74%-when temperature falls from 30°C to 12.5°C, but methane production collapses by roughly 72% over the same range . In practical terms, if biogas recovery is part of your business case, you need to keep the reactor warm; if you only care about COD removal, anaerobic systems are more forgiving than they look.
Aerobic polishing follows anaerobic treatment to bring residual BOD and nutrients down to discharge levels. Conventional activated sludge, sequencing batch reactors (SBR), and membrane bioreactors (MBR) are all used. MBR is particularly attractive when space is tight or when water reuse is a goal, because the membrane provides a physical barrier that produces consistently low-turbidity effluent suitable for further treatment or reuse .
Matching Treatment Technologies to Your Discharge Route
The treatment train you build depends entirely on where the water goes. Discharging to a municipal sewer under a trade waste agreement is a fundamentally different problem from discharging to a river under a direct environmental permit.
| Discharge Route | Typical Constraints | Treatment Implication |
| Municipal Sewer (Trade Waste) | High organic load accepted but surcharged; FOG and pH limits enforced | Primary treatment (DAF) + pH balancing may suffice; biological treatment optional if surcharge costs are lower than capital costs |
| Direct Discharge to Water Body | Strict limits on BOD, COD, TSS, nutrients, and FOG | Full treatment train: primary + anaerobic + aerobic + nutrient removal + polishing |
| Land Application / Irrigation | Limits on sodium, nutrients, and pathogens; groundwater protection | Anaerobic treatment + storage + nutrient management; pathogen reduction may be required |
| Water Reuse (Internal) | Fit-for-purpose quality; often requires membrane filtration and disinfection | MBR or UF/RO polishing after biological treatment; high capital but reduces water intake costs |
The European Union’s urban wastewater directive, for reference, sets COD at <125 mg/L, BOD₅ at <25 mg/L, and TSS at <35 mg/L for discharges to sensitive areas . Direct dischargers in Germany face even tighter COD limits at <110 mg/L and phosphorus at <1 mg/L . If you are discharging to a municipal sewer in Australia, typical trade waste limits allow BOD up to 300–600 mg/L and COD up to 1,000 mg/L, but the water authority will charge you for every kilogram of organic load above a baseline . The economics often favor pretreatment to reduce the surcharge, even when the sewer technically “accepts” the load.
Common Operational Pitfalls and How to Avoid Them
Even a well-designed treatment plant can fail in operation. Dairy effluent is variable by nature, and systems that are not built for shock loads will show stress quickly.
pH crashes from CIP discharge. Caustic and acid cleaning cycles can send pH swinging from 4 to 11 within hours. If this hits an anaerobic reactor, methanogens-which are sensitive to pH-shut down, and recovery can take weeks. Equalization tanks with active pH correction and buffering capacity are not optional for dairy plants with aggressive CIP schedules .
Fat overload on biological systems. A whey spill or a butter line discharge can send FOG surging past the DAF unit and into the bioreactor. The result is filamentous bulking, poor settleability, and loss of biomass through the clarifier. Early warning monitoring-turbidity, FOG grab samples, or online COD-gives operators time to divert high-fat streams to holding tanks before they reach the biology.
Nutrient imbalance for aerobic treatment. Dairy wastewater is rich in carbon but can be relatively low in nitrogen and phosphorus for optimal aerobic biomass growth. If your BOD-to-nitrogen ratio is off, you may need to dose nutrients to keep the activated sludge healthy. Conversely, if nutrient discharge limits are tight, you may need to design for nitrogen and phosphorus removal rather than just carbon oxidation.
Sludge handling bottlenecks. DAF sludge, biological waste sludge, and anaerobic digestate all need somewhere to go. Plants that ignore sludge logistics during design often end up with a treatment system that works beautifully on paper but is bottlenecked by trucking costs or dewatering capacity. Co-composting DAF sludge with bulking agents is one option; anaerobic digestion of the sludge for biogas recovery is another .
Resource Recovery: Turning Treatment Costs into Operational Value
The most forward-looking dairy processors are no longer treating wastewater as a pure cost. The organic load in dairy effluent is energy waiting to be captured.
Anaerobic digestion of high-strength dairy wastewater produces biogas with roughly 60–70% methane content. For a plant with a COD load in the tens of thousands of mg/L, the methane generated can offset a meaningful portion of the facility’s thermal energy demand-boiler fuel, process hot water, or even electricity through a CHP unit. The key economic driver is temperature: mesophilic digestion at 35–37°C requires heating the influent, but the biogas yield justifies the input for medium to large plants .
Beyond energy, the nutrients in dairy wastewater-nitrogen and phosphorus-are fertilizer precursors. Land application of treated effluent is common in regions with available agricultural land, provided the sodium adsorption ratio and nutrient loading are managed. Struvite precipitation from anaerobic digestate is an emerging option for recovering phosphorus as a slow-release fertilizer, though the economics remain site-specific.
Water reuse is the third recovery avenue. MBR-treated effluent can be polished with reverse osmosis and disinfected for use as CIP pre-rinse water, boiler feedwater make-up, or cooling tower makeup. The capital cost is high, but for plants in water-stressed regions or those facing escalating water tariffs, the payback can be compelling .
Regulatory Compliance: What You Need to Verify Before Design
Every treatment design must start with the discharge limits you are legally obligated to meet. These vary dramatically by jurisdiction and receiving environment. The table below illustrates the range.
| Parameter | EU Urban Wastewater (Sensitive Area) | Germany (Direct Discharge) | Australia (Typical Trade Waste) |
| BOD₅ | < 25 mg/L | < 20 mg/L | < 300–600 mg/L |
| COD | < 125 mg/L | < 110 mg/L | < 1,000 mg/L |
| TSS | < 35 mg/L | < 30 mg/L | < 400–600 mg/L |
| FOG | < 15 mg/L | < 10 mg/L | < 15 mg/L |
| Total Nitrogen | < 15 mg/L | < 18 mg/L | < 50 mg/L |
| Total Phosphorus | < 2 mg/L | < 1 mg/L | < 10 mg/L |
Limits summarized from regional discharge standards; always verify with your local authority .
The practical rule is simple: do not design to the limit. Design to a margin of 20–30% below the limit so that operational upsets do not become permit violations. Dairy effluent is too variable to assume steady-state performance.
Frequently Asked Questions
How much does a dairy wastewater treatment system cost?
Capital costs vary widely based on flow rate, influent strength, and discharge limits. A primary DAF system with pH correction for sewer discharge might fall in the low-to-mid six figures, while a full anaerobic-plus-aerobic train with nutrient removal and reuse polishing can run into the millions. Operating costs-chemicals, energy, sludge disposal, and labor-typically dominate the lifecycle cost, so energy recovery from anaerobic digestion materially improves the business case.
Can dairy wastewater be discharged to a municipal sewer without treatment?
Technically yes in many jurisdictions, but the trade waste surcharges will be severe. Municipal authorities typically charge based on both volume and organic load (BOD/COD) plus suspended solids. For high-strength dairy effluent, the annual surcharge can exceed the amortized cost of pretreatment within a few years. Most dairy processors find that at least primary treatment-DAF or equivalent-pays for itself through reduced surcharges.
What is the biggest operational risk in dairy wastewater treatment?
Shock loads from product loss or CIP discharges. A single tank dump of whey or a caustic cleaning cycle sent to the biological system can cause weeks of recovery time. Equalization capacity, pH monitoring, and diversion protocols are the most important defensive measures you can build into a dairy treatment plant.
Talk to Us About Your Dairy Effluent Challenge
Every dairy plant has a different product mix, a different discharge route, and a different cost structure. The treatment train that works for a cheese factory in one region may be overbuilt or undersized for a yogurt plant elsewhere. If you are planning a new system, upgrading an existing plant, or struggling with compliance or surcharge costs, our team can help you evaluate the right process configuration and build a realistic budget.
Contact us with your effluent analysis and discharge requirements, and we will provide a technical assessment and preliminary process design tailored to your operation.