
Do Biogas Plants Earn From Energy or Tipping Fees?
Most biogas plants earn more from energy than from tipping or gate fees—electricity, heat, and upgraded biomethane (plus related certificates) are usually the largest and steadiest income. Gate or tipping fees are a valuable add-on, and can dominate only in niche cases where landfill diversion is mandated or energy offtake is weak.
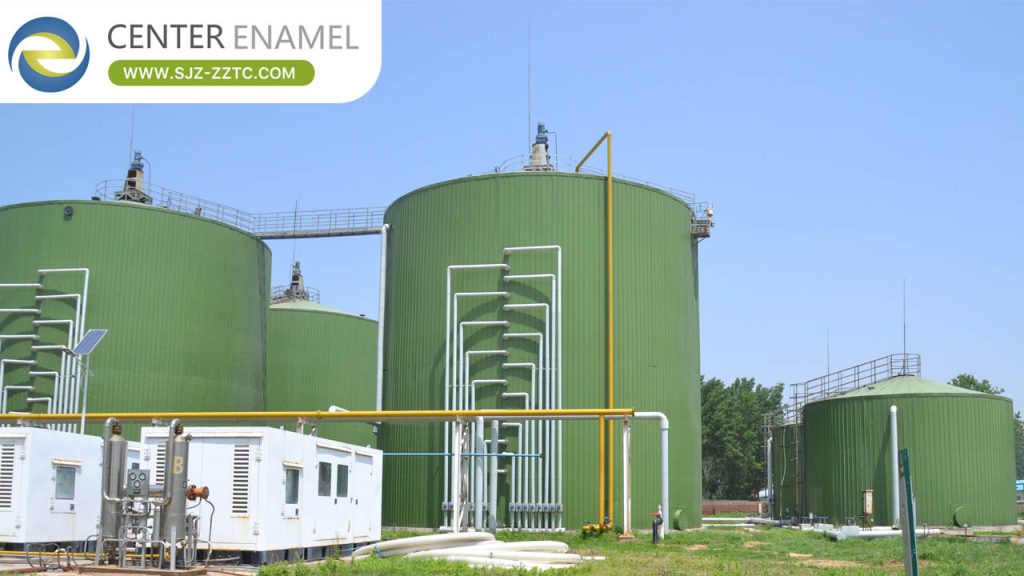
The Two Revenue Streams
Energy income covers electricity sold or self-used, heat sold or used, and biomethane injected or dispensed as vehicle fuel—often boosted by renewable certificates, carbon credits, or fuel mandates. Gate/tipping fees are payments to accept organic feedstock. A well-run plant stacks both: energy from the gas, a fee for the incoming waste.
Why Energy Usually Leads
Energy scales with the biogas itself. A plant producing 0.30–0.45 m³ of biogas per kg of COD removed and burning it in CHP at 35–45% electrical efficiency generates a large, predictable flow that compounds with certificates. Gate fees, by contrast, are capped by local waste economics and spare intake capacity—they top up rather than anchor the business.
When Gate Fees Dominate
Gate fees lead where energy is hard to monetize—no grid connection, no heat off-take, weak renewable tariffs—but landfill diversion is mandated and generators pay to avoid it. Some manure or agricultural plants even pay to receive feedstock (negative gate fee) and rely almost entirely on energy; the sign flips with the feedstock.
Comparative Data Table: Revenue Mix by Plant Type
| Plant type | Energy share | Gate/tipping share | Note |
| Municipal sludge AD | dominant | minor / none | own waste, no fee |
| Food-waste AD | large | significant | fee fills spare capacity |
| Manure / farm AD | dominant | often negative | may pay to receive |
| Mandated-diversion AD | variable | can dominate | where energy weak |
Technical Considerations
Revenue mix drives design. A plant leaning on energy needs secure grid/heat offtake and certificate eligibility; one leaning on gate fees needs intake contracts, receiving infrastructure, and strict feedstock specs. Over-reliance on either is risky—diversification is the hedge.
Advantages and Limitations
Energy income is scalable and tied to a real product (power/heat/fuel); gate fees improve payback and use spare capacity. Limits: energy depends on tariffs and offtake; gate fees depend on shifting waste policy and local landfill costs. The resilient plant earns from both.
Best Practices / How to Balance
Design the core around energy (secure offtake, certificates, CHP sizing), then use gate fees to fill spare digester capacity with clean, high-energy feedstock. Spec the intake contract for quality, and never let fee income crowd out energy optimization—energy is the durable engine.
Biogas plants earn mainly from energy, with gate or tipping fees as a strong but secondary add-on that dominates only where energy offtake is weak and diversion is mandated. The resilient model stacks both—energy as the engine, fees as the top-up.
Frequently Asked Questions (FAQ)
Q1: Do biogas plants earn from energy or tipping fees?
A: Mainly from energy—electricity, heat, and biomethane plus certificates are usually the largest, steadiest income; gate/tipping fees are a valuable add-on.
Q2: Which is bigger?
A: Energy, for most plants, because it scales with biogas (0.30–0.45 m³/kg COD, 35–45% CHP electrical) and compounds with certificates; gate fees are capped by local waste economics.
Q3: When do gate fees dominate?
A: Where energy is hard to monetize (no grid/heat offtake, weak tariffs) but landfill diversion is mandated—generators then pay to avoid dumping, and the fee leads.
Q4: Do manure plants get gate fees?
A: Often the opposite—some farm AD plants pay to receive manure (negative gate fee) and rely almost entirely on energy from the gas.
Q5: What is the best revenue mix?
A: Energy as the core (secure offtake + certificates), gate fees filling spare capacity with clean feedstock. Diversification hedges against tariff or policy shifts.
Q6: Can fees replace energy income?
A: Rarely and only in mandated-diversion niches. Relying on fees alone ignores the gas value and leaves the plant exposed to waste-policy swings.
Project Case Reference
Malaysia Biogas Project — Malaysia · 2026
5 GFS Tanks · 27,000 m³ Total Volume · 22,000 m³ Biogas/Day
A large-scale biogas project in Malaysia featuring 5 Glass-Fused-to-Steel (GFS) tanks. The project achieves approximately 80% digestibility, with each single tank producing about 4,400 m³ of biogas daily, totaling 22,000 m³ per day across all 5 tanks.
Technical Specifications
Single Tank Volume: 5,400 m³ (Ø24.46 × 12 m)
Total Effective Volume: 27,000 m³ (5 tanks)
Daily Biogas Production: 22,000 m³ total
Digestibility: ≈ 80%
Gas Production Rate: 0.45 m³ / kg COD removed
Tank Type: Glass-Fused-to-Steel (GFS)
Water Quality Data
| Parameter | Inlet Water | Effluent |
| COD | ≥ 60,000 mg/L | ≥ 12,000 mg/L |
| BOD | ≤ 25,000 mg/L | ≤ 5,000 mg/L |