
What Is the Payback Period for a Dung Biogas Plant?
The payback period for a dung biogas plant is typically 5–9 years for a turnkey anaerobic digestion plus CHP system, recovered through three streams: on-site electricity and heat offset, digestate fertilizer savings, and lower manure handling and odour-compliance cost. Well-sited plants with cheap financing and high grid/heat value land near the low end of that range.
Where the Money Comes Back From
A 500-cow dairy at 15–30 kW electric offsets a meaningful share of farm power and displaces propane or oil for heating, while the digestate returns nitrogen, phosphorus, and potassium to the land—cutting synthetic fertilizer purchases. Manure that once cost money to store, haul, and spread as raw slurry becomes a valued input plus an energy source, and odour and pathogen reduction can lower regulatory and neighbour-risk cost.
Comparative Data Table: Payback Drivers
| Revenue / saving stream | Effect on payback | Notes |
| On-site electricity offset | strong | 0.7–1.4 kWh/cow/day |
| Heat reuse (digestion + buildings) | moderate-strong | raises total energy use to 80–90% |
| Digestate fertilizer value | moderate | retains N-P-K vs synthetic |
| Manure handling saving | moderate | less hauling, odour control |
| Grid export / feed-in tariff | variable | jurisdiction dependent |
| Financing cost | negative | lower rate → faster payback |
Why It Varies and How to Shorten It
Payback stretches when the electricity has no on-site use, when digestate cannot be land-applied, or when capital is expensive. It shortens when heat is usefully recovered (biogas CHP reaches 80–90% total energy efficiency), when the farm already pays high retail power or fossil heat prices, and when co-digestion adds throughput without new land. Sizing the CHP to base-load demand rather than peak demand avoids running the engine below efficient load.
Frequently Asked Questions (FAQ)
Q1: What is the payback period for a dung biogas plant?
A: Typically 5–9 years for a turnkey AD-CHP system, recovered through on-site power and heat offset, digestate fertilizer savings, and lower manure handling and compliance cost.
Q2: What revenues shorten payback?
A: Useful heat recovery (total CHP efficiency 80–90%), high retail power or fossil-heat prices to offset, land-applied digestate that replaces synthetic fertilizer, and any grid export tariff available locally.
Q3: Why does payback vary so much?
A: It depends on on-site energy value, whether digestate can be spread, capital cost and financing, and how well the CHP is loaded. Idle heat and expensive debt push it toward 9 years; tight design and cheap energy push toward 5.
Q4: How can I speed it up?
A: Size the CHP to base-load demand, recover heat for digestion and buildings, co-digest to raise throughput, and apply digestate on owned land. Lower financing cost and high offset prices do the rest.
Project Case Reference
Malaysia Biogas Project — Malaysia · 2026
5 GFS Tanks · 27,000 m³ Total Volume · 22,000 m³ Biogas/Day
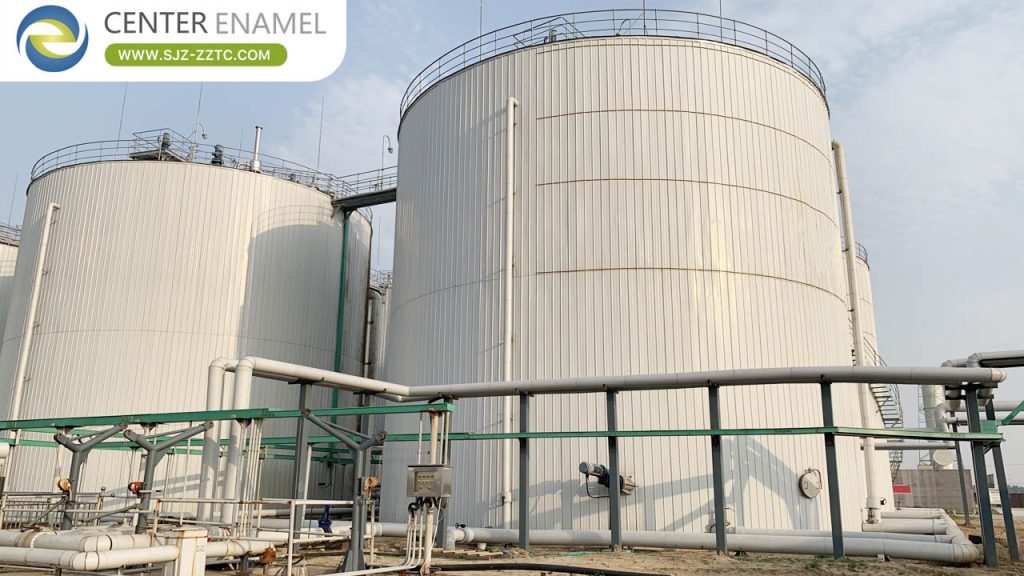
A large-scale biogas project in Malaysia featuring 5 Glass-Fused-to-Steel (GFS) tanks. The project achieves approximately 80% digestibility, with each single tank producing about 4,400 m³ of biogas daily, totaling 22,000 m³ per day across all 5 tanks.
Technical Specifications
Single Tank Volume: 5,400 m³ (Ø24.46 × 12 m)
Total Effective Volume: 27,000 m³ (5 tanks)
Daily Biogas Production: 22,000 m³ total
Digestibility: ≈ 80%
Gas Production Rate: 0.45 m³ / kg COD removed
Tank Type: Glass-Fused-to-Steel (GFS)
Water Quality Data
| Parameter | Inlet Water | Effluent |
| COD | ≥ 60,000 mg/L | ≥ 12,000 mg/L |
| BOD | ≤ 25,000 mg/L | ≤ 5,000 mg/L |