
What Is the ROI of a Biomass Project? Economics, Payback Periods, and Risk Analysis
A well-executed biomass project delivers a payback period of 5–9 years and an internal rate of return (IRR) of 8–14% in most markets, with gate-fee-receiving AD projects at the top of that range. But ROI varies by a factor of three depending on scale, feedstock cost, and revenue stack—electricity, heat, byproducts, and subsidies—which is why this analysis breaks the economics into measurable drivers.
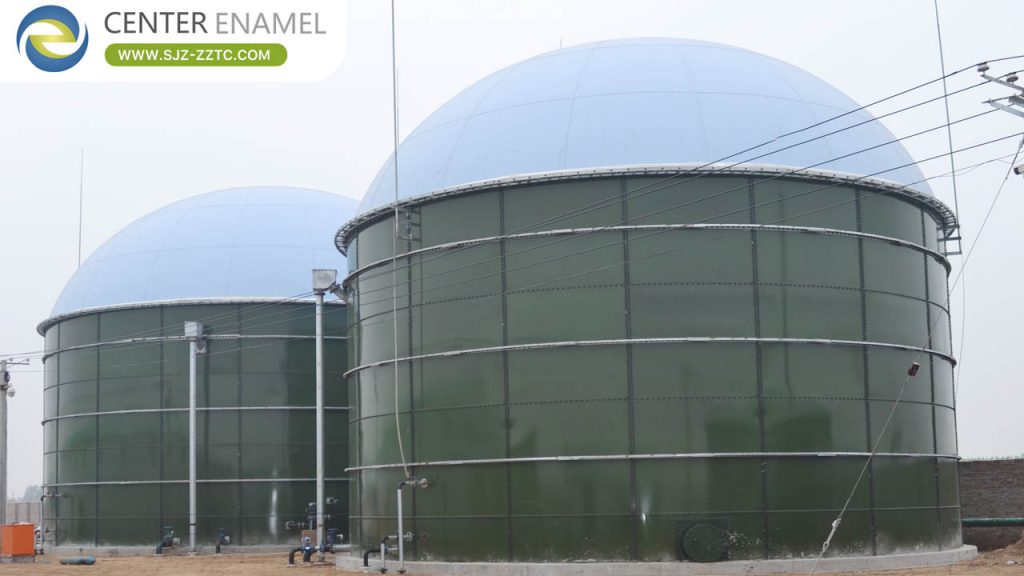
CAPEX Benchmarks by Scale and Technology
2026 capital costs per installed electrical kW: combustion plants €2,500–4,000/kW₎ (5–50 MW₎), gasification plants €3,500–5,000/kW₎ (1–20 MW₎), and AD-CHP plants €3,500–6,000/kW₎ (0.05–5 MW₎). AD with biomethane upgrading adds 30–50% to CAPEX but can double per-unit gas revenue. Civil works and grid connection typically add 20–30% on top of equipment.
Revenue Streams: The Four-Layer Stack
Layer 1 — Electricity: feed-in tariffs or power purchase agreements, €80–150/MWh depending on market; 25–43% of output becomes salable electricity.
Layer 2 — Heat: district heating or industrial steam at €20–40/MWh, typically adding 10–20% to total revenue where an off-taker exists.
Layer 3 — Byproducts and gate fees: digestate fertilizer for AD plants; gate fees of €30–90/tonne for food waste—often the difference between 6% and 12% IRR.
Layer 4 — Incentives: renewable energy certificates, carbon credits, and capital grants that can cover 20–40% of CAPEX in supportive jurisdictions (e.g., EU Cohesion funds, US IRA tax credits).
Comparative Data Table: ROI Model for Three Reference Projects
| Reference Project | 500 kW₎ AD-CHP | 2 MW₎ AD + Upgrading | 20 MW₎ Wood Combustion |
| Total CAPEX | €2.2–2.8 M | €9–12 M | €55–80 M |
| Annual revenue | €0.6–0.9 M | €2.5–3.5 M | €12–18 M |
| Annual O&M | €0.15–0.22 M | €0.7–1.0 M | €4–6 M |
| Typical payback | 5–7 years | 6–8 years | 7–9 years |
| IRR range | 10–14% | 9–13% | 7–10% |
| Key revenue driver | Gate fees + FIT | Biomethane premium | PPA + heat off-take |
The Five Risks That Destroy Biomass ROI
Risk 1 — Feedstock price volatility: fuel can be 30–50% of OPEX; secure 3–5-year contracts before financial close. Risk 2 — Feedstock availability: a 20 MW wood plant needs ~200,000 tonnes/year; verify sustainable supply radius. Risk 3 — Regulatory change: tariff or incentive cuts; build revenue stacks with minimal subsidy dependence. Risk 4 — Technology performance gap: demand guaranteed output parameters in the EPC contract. Risk 5 — Grid curtailment: secure connection capacity and negotiate curtailment compensation.
The 2026 rule of thumb: a biomass project is bankable when (1) feedstock is contractually secured at a fixed price index, (2) at least two revenue layers exist independently of subsidies, and (3) the EPC provider guarantees minimum performance. Projects meeting all three conditions consistently land in the 9–14% IRR band.
Frequently Asked Questions (FAQ)
Q1: What is the typical payback period of a biomass power plant?
A: Five to nine years in most markets—5–7 for AD-CHP plants with gate fees, 7–9 for large combustion plants. Projects without gate fees or heat off-take can stretch beyond 10 years and are rarely financed on equity alone.
Q2: How profitable are biomass projects compared to solar and wind?
A: Biomass typically shows slightly higher IRR (9–14% vs 6–10%) because it generates dispatchable power and multiple revenue streams—but with higher feedstock and operational risk. Investors trade this risk premium for baseload reliability.
Q3: Can I get financing for a biomass project without subsidies?
A: Yes, if the revenue stack stands on its own: PPA plus gate fees plus heat sales. Banks will lend at 60–70% debt-to-capital when feedstock is contracted and the EPC carries performance guarantees.
Q4: What is the single biggest ROI killer in biomass?
A: Feedstock cost volatility and availability. A 30% fuel cost increase can wipe out 40–50% of project NPV, which is why long-term feedstock contracts are the first thing lenders demand.