
What Reduces WWTP Energy Demand?
The biggest reductions in WWTP energy demand come from improving aeration efficiency and process control, because aeration alone often accounts for 40–60% of a plant's electricity use. High-efficiency blowers, variable-frequency drives, dissolved-oxygen-based control, and shifting strong streams to anaerobic treatment are the highest-impact levers.
Where the Energy Goes
A typical municipal plant spends its power on aeration (the largest single block), pumping and mixing, and sludge dewatering and heating. Targeting the largest block first gives the fastest payback: a 30% cut in aeration load beats a 30% cut in a 5% load many times over. Energy audits that meter by end-use are the starting point.
Aeration — The Prime Target
Conventional diffused-air systems waste energy through over-aeration and poor control. Replacing blowers with turbo or high-efficiency units, adding VFDs, and closing the loop with online dissolved-oxygen sensors typically cuts aeration energy by 20–50%. Right-sizing return-activated-sludge rates and avoiding nitrification when the permit allows also trims load without risking compliance.
Anaerobic Treatment of Strong Streams
Where a plant receives high-strength industrial or sludge sidestreams, treating them anaerobically instead of aerobically avoids the 0.5–1.5 kWh/kg COD aeration cost entirely and instead produces 0.30–0.45 m³ of biogas per kg COD removed. Moving even part of the load off the aerobic train can remove a large, avoidable energy bill while adding an energy credit.
Comparative Data Table: Demand-Reduction Levers
| Lever | Typical saving | Notes |
| Efficient blowers + VFD | 20–50% aeration | highest impact |
| DO-based control | 10–30% aeration | pairs with VFD |
| Anaerobic for strong streams | removes aeration of that load | adds biogas credit |
| Pump / mixer optimization | 5–15% total | easy win |
| Heat recovery | cuts digester heating | raises total efficiency |
Technical Considerations
Savings must not compromise effluent quality. DO control needs reliable sensors and calibration; anaerobic sidestream treatment needs steady, biodegradable feed and temperature control (mesophilic 35–38°C). Instrumentation and operator training are the unglamorous prerequisites that make the savings stick.
Advantages and Limitations
Demand reduction is the cheapest energy strategy—it avoids capital on generation you no longer need and pays back fast. Its limit is that it cannot take a plant below its irreducible minimum; to reach neutrality you still pair it with recovery. But every kWh you do not use is a kWh you do not have to generate.
Best Practices / How to Start
Meter energy by end-use, then attack aeration with efficient blowers, VFDs, and DO control. Reroute any high-strength sidestream to anaerobic treatment. Optimize pumps and mixers, and recover digester heat. Re-audit annually—loads drift as flows and regulations change.
What reduces WWTP energy demand most is better aeration: efficient blowers, VFDs, and DO control cut the dominant 40–60% load by 20–50%, while anaerobic treatment of strong streams removes aeration cost outright and adds biogas. Reduce first, then recover.
Frequently Asked Questions (FAQ)
Q1: What reduces WWTP energy demand most?
A: Improving aeration efficiency—efficient blowers, VFDs, and DO-based control—because aeration is typically 40–60% of plant electricity.
Q2: Which load is biggest?
A: Aeration, the largest single energy block; pumping/mixing and sludge dewatering/heating follow. Targeting aeration first gives the fastest payback.
Q3: How much can aeration save?
A: Typically 20–50% via high-efficiency blowers, VFDs, and dissolved-oxygen control, without changing the treatment outcome.
Q4: Does anaerobic treatment help demand?
A: Yes—treating strong streams anaerobically avoids the 0.5–1.5 kWh/kg COD aeration cost and produces biogas instead, removing load and adding credit.
Q5: Will savings hurt effluent quality?
A: Not if done with proper DO control and calibration. The goal is right-aeration, not under-aeration; compliance must be monitored.
Q6: Should I reduce before adding solar or CHP?
A: Yes. Every kWh you avoid is cheaper than one you generate; reduce demand first, then size any generation to the smaller remaining gap.
Project Case Reference
Malaysia Biogas Project — Malaysia · 2026
5 GFS Tanks · 27,000 m³ Total Volume · 22,000 m³ Biogas/Day
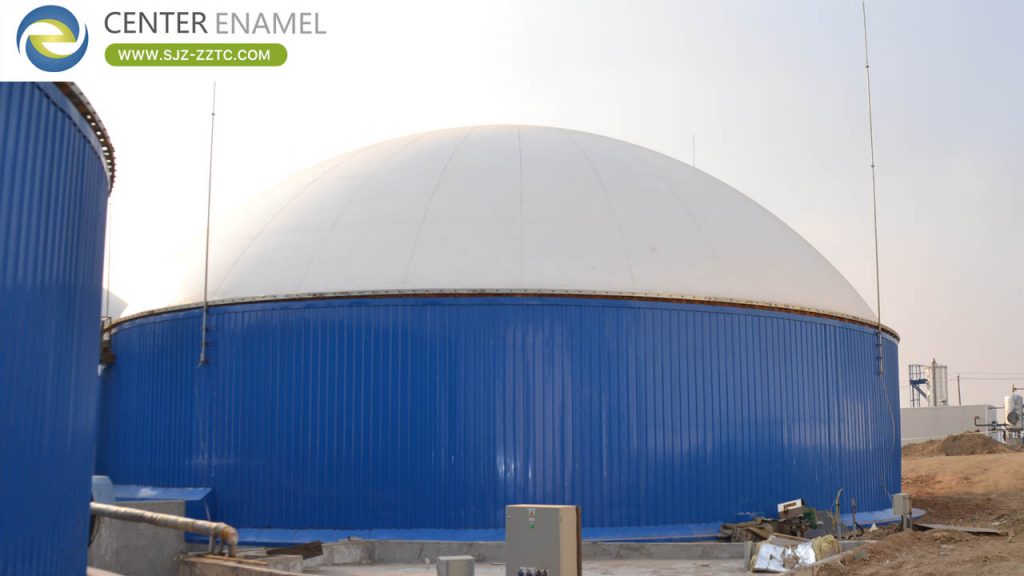
A large-scale biogas project in Malaysia featuring 5 Glass-Fused-to-Steel (GFS) tanks. The project achieves approximately 80% digestibility, with each single tank producing about 4,400 m³ of biogas daily, totaling 22,000 m³ per day across all 5 tanks.
Technical Specifications
Single Tank Volume: 5,400 m³ (Ø24.46 × 12 m)
Total Effective Volume: 27,000 m³ (5 tanks)
Daily Biogas Production: 22,000 m³ total
Digestibility: ≈ 80%
Gas Production Rate: 0.45 m³ / kg COD removed
Tank Type: Glass-Fused-to-Steel (GFS)
Water Quality Data
| Parameter | Inlet Water | Effluent |
| COD | ≥ 60,000 mg/L | ≥ 12,000 mg/L |
| BOD | ≤ 25,000 mg/L | ≤ 5,000 mg/L |